Close icon
Book An Online Meeting

 Eniris BMS 

For residential, commercial, and industrial buildings

Software and hardware for energy monitoring and control.

With Eniris BMS, we offer installation and maintenance companies a reliable and clear way to monitor climate conditions and track energy consumption. What's more, the portal can be white-labeled.

Software

Energie Management System

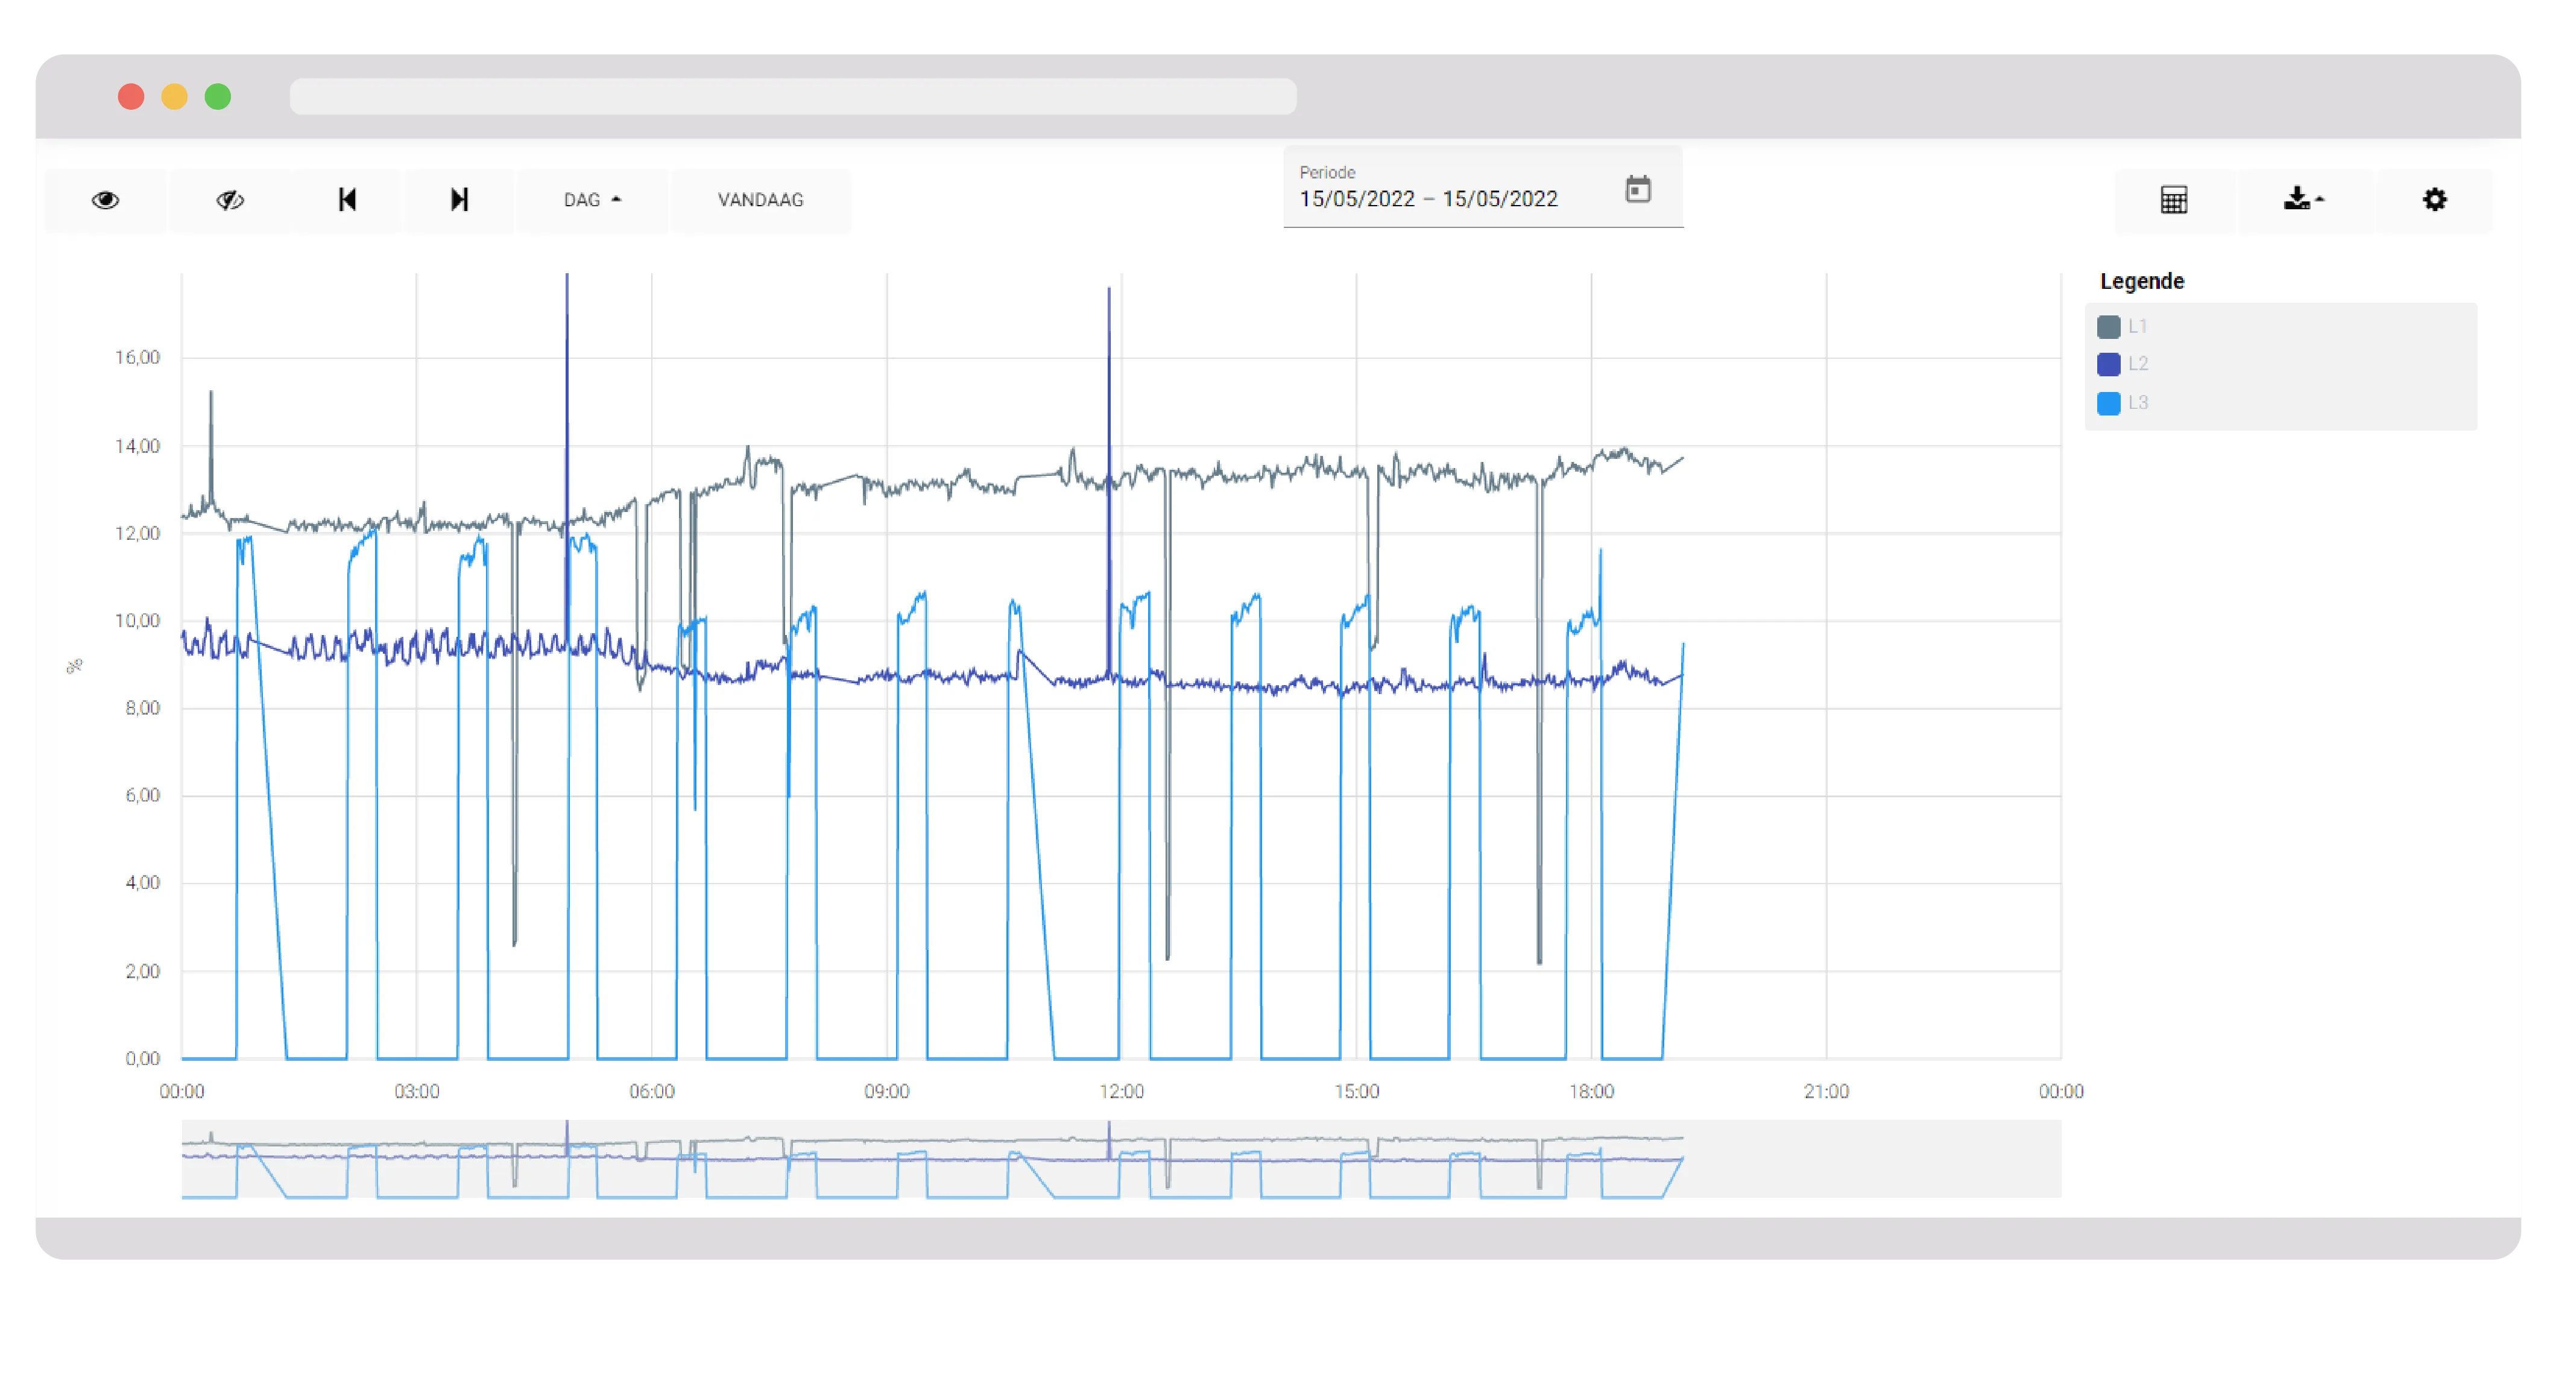
Eniris BMS is a solution that visualizes and compares building performance. It offers real-time monitoring of consumption and production, identifies anomalies with alarm management, and features a comprehensive reporting tool.

Brand-Independent

+250 Integrations

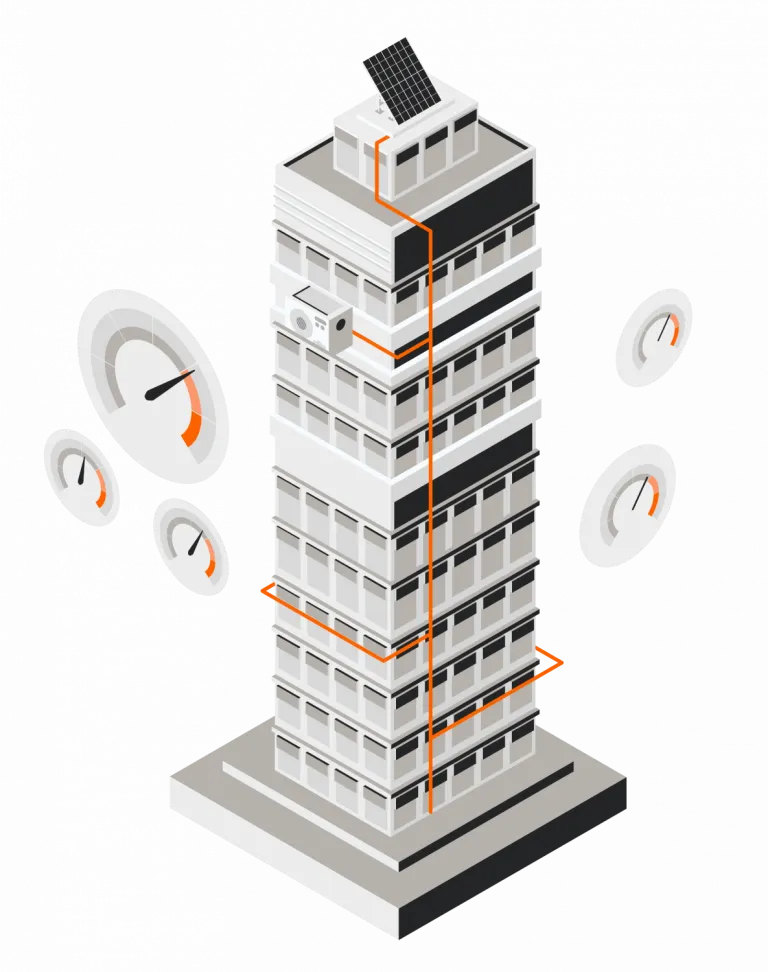
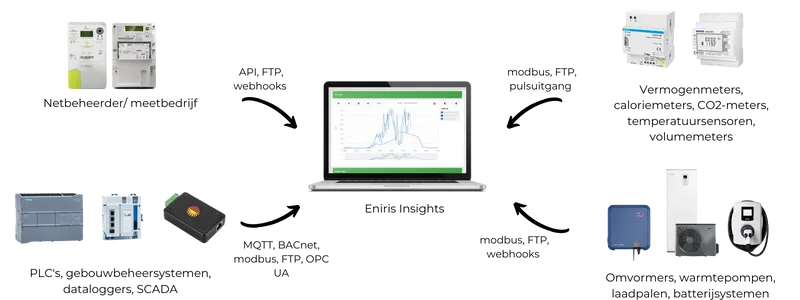
Every environment has different machines of different brands and ages. Eniris processes a wide range of protocols and interfaces.

View all integrations with accompanying documentation
Logo Power Sonic
Logo Sofar
Logo Solis Inverters
Logo Victron Energy
Logo Afore
Logo AlphaESS
Logo a-Tronix
Logo Ampowr
Logo APsystems
Logo K-Star
Logo SAJ
Logo Huawei
Logo Kehua
Logo Marstek
Logo Sigenergy
Logo SMA
Logo SolarEdge
Logo Solinteg
Logo Sungrow
Logo suspower
Logo Power Sonic
Logo Sofar
Logo Solis Inverters
Logo Victron Energy
Logo Afore
Logo AlphaESS
Logo a-Tronix
Logo Ampowr
Logo APsystems
Logo K-Star
Logo SAJ
Logo Huawei
Logo Kehua
Logo Marstek
Logo Sigenergy
Logo SMA
Logo SolarEdge
Logo Solinteg
Logo Sungrow
Logo suspower
Logo Power Sonic
Logo Sofar
Logo Solis Inverters
Logo Victron Energy
Logo Afore
Logo AlphaESS
Logo a-Tronix
Logo Ampowr
Logo APsystems
Logo K-Star
Logo SAJ
Logo Huawei
Logo Kehua
Logo Marstek
Logo Sigenergy
Logo SMA
Logo SolarEdge
Logo Solinteg
Logo Sungrow
Logo suspower
Logo Power Sonic
Logo Sofar
Logo Solis Inverters
Logo Victron Energy
Logo Afore
Logo AlphaESS
Logo a-Tronix
Logo Ampowr
Logo APsystems
Logo K-Star
Logo SAJ
Logo Huawei
Logo Kehua
Logo Marstek
Logo Sigenergy
Logo SMA
Logo SolarEdge
Logo Solinteg
Logo Sungrow
Logo suspower
Logo AlphaESS
Logo autarco
Logo Growatt
Logo Goodwe
Logo Fronius
Logo FoxESS
Logo DEYE
Logo Energreen
Logo Exide Technologies
Logo APsystems
Logo ABB
Logo AlphaESS
Logo autarco
Logo Growatt
Logo Goodwe
Logo Fronius
Logo FoxESS
Logo DEYE
Logo Energreen
Logo Exide Technologies
Logo APsystems
Logo ABB
Logo AlphaESS
Logo autarco
Logo Growatt
Logo Goodwe
Logo Fronius
Logo FoxESS
Logo DEYE
Logo Energreen
Logo Exide Technologies
Logo APsystems
Logo ABB
Logo AlphaESS
Logo autarco
Logo Growatt
Logo Goodwe
Logo Fronius
Logo FoxESS
Logo DEYE
Logo Energreen
Logo Exide Technologies
Logo APsystems
Logo ABB

Manage all installations from a single platform

Dashboard showing energy and utility meter data for multiple buildings, including electricity, water, gas, heat, cold meters, temperature, CO2, and electrical consumption and production in kWh.

Technology Agnostic

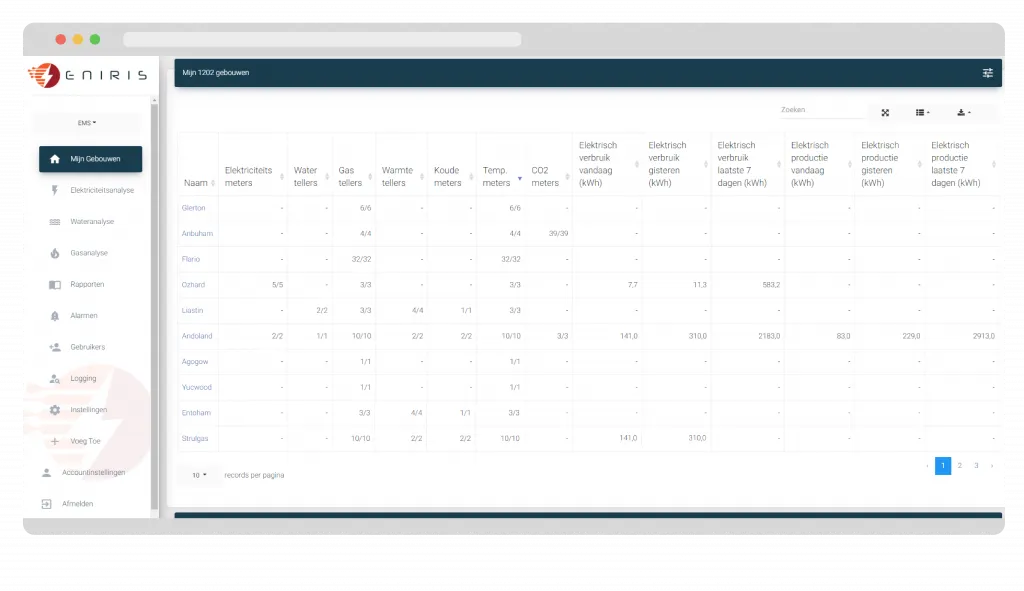
At a glance, you have insight into the most important parameters of buildings, installations, equipment, production lines, etc.

  • Consumption data (gas, heat, water, electricity, cooling, etc.), production data (e.g., energy, raw materials, etc.) and consumption costs.
  • Ratios (e.g., consumption per production).
  • Connectivity of the meters.
  • Error messages.

Older systems

Not all alarms are created equal, and our BMS understands that. We offer the flexibility to assign priorities to different alarms based on their impact on your operational processes. This means you can immediately focus on the most critical situations and take the appropriate action.

Futureproofing

Receiving real-time alerts for deviations in energy consumption, performance, or safety is essential for responding quickly. Our BMS provides instant notifications via multiple channels, including mobile apps, email, and text messages, so you are always informed, wherever you are.

Alarm Management

Stay informed

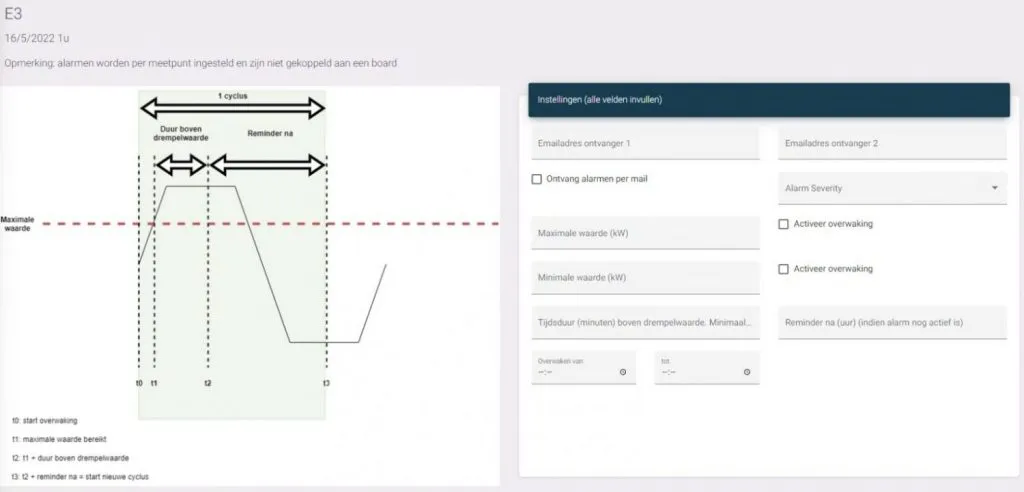
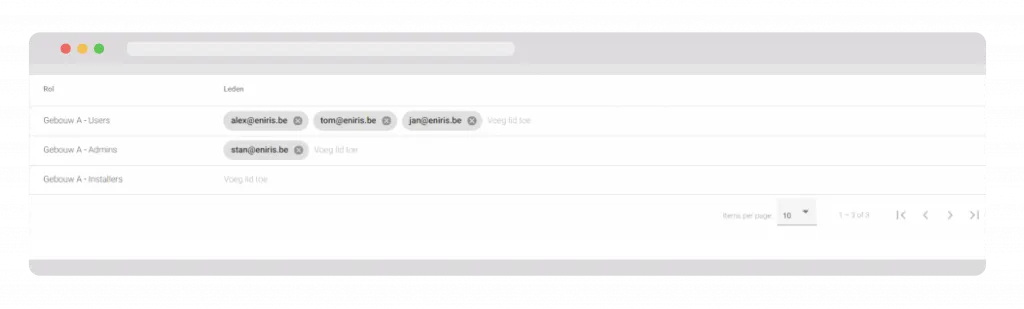
Set your own alarm thresholds independently of the underlying control systems.

  • Centralized registration and processing.
  • Assign different priorities.
  • Forward alarms by email or SMS (optional).
  • Integration with your ERP system/digital work orders.
  • Ticketing.
Diagram showing alarm threshold cycle with maximum value line and timing annotations on the left, and alarm settings form on the right with fields for email receivers, alarm severity, max/min values, duration above threshold, and activation checkboxes.

Map view

Laptop screen displaying an interactive map of the Netherlands and surrounding areas with red and green location markers.

Your complete portfolio at a glance

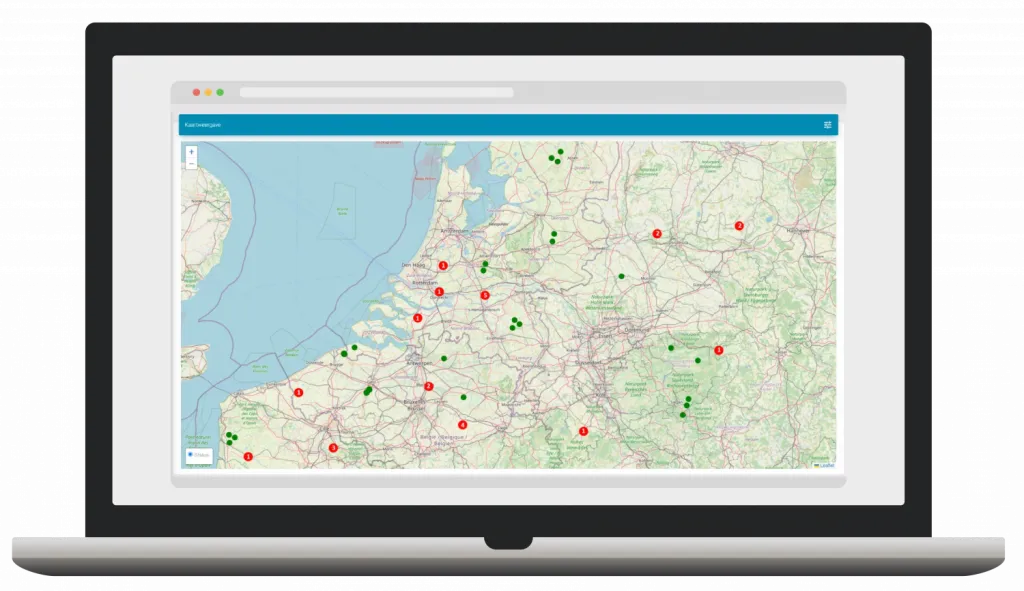
Identifying problems in the portfolio is particularly easy thanks to the clear map display.

  • Various filters: normal operation, critical alarm, etc.
  • Click through directly to the installation.

Widget

Choose from dozens of widgets

Each dashboard has a simple interface that allows you to:

  • Activate specific widget functions.
  • Activate or deactivate widgets.
  • Select measurement points.
Dashboard interface displaying tables of data with columns for name, preview, and wiki dates, alongside a sidebar menu with options in Dutch.

Widgets

Not all alarms are created equal, and our BMS understands that. We offer the flexibility to assign priorities to different alarms based on their impact on your operational processes. This means you can immediately focus on the most critical situations and take the appropriate action.

Charts

Receiving real-time alerts for deviations in energy consumption, performance, or safety is essential for responding quickly. Our EMS provides instant notifications via multiple channels, including mobile apps, email, and text messages, so you are always informed, wherever you are.

Your customer portal

User management interface listing roles: Gebouw A - Users with three users, Gebouw A - Admins with one admin, and Gebouw A - Installers with no members, showing email addresses and options to add members.

Sustainable customer loyalty in no time.

  • Simple user management
  • Access to various buildings or installations from a single portal
  • Access to all consumption reports or financial analyses
  • White labeling
  • Your own logos
  • Accessible via your URL
  • Color scheme according to your corporate identity

Multisite Benchmarking

Combine various installations or buildings and compare them in a single overview.

Energy consumption pie chart showing total 76,833.83 kWh from various buildings, with building C using 70.5%, building G 18.4%, building B 10.8%, and others less than 1%.

All the tools you need for analysis

Line graph showing daily kWh usage from May 9 to May 15, 2022, with four colored lines representing ALSB A, ALSB B, ALSB C, and total consumption peaking daily around 8 kWh.
Bar chart comparing monthly kWh energy consumption for 2021 and 2022, with 2022 values in orange and 2021 in teal, showing higher usage in early 2022 and a decline toward the end of the year.
Line chart showing three datasets labeled L1, L2, L3 with values fluctuating between 0% and 16% across a 24-hour period on 15/05/2022.

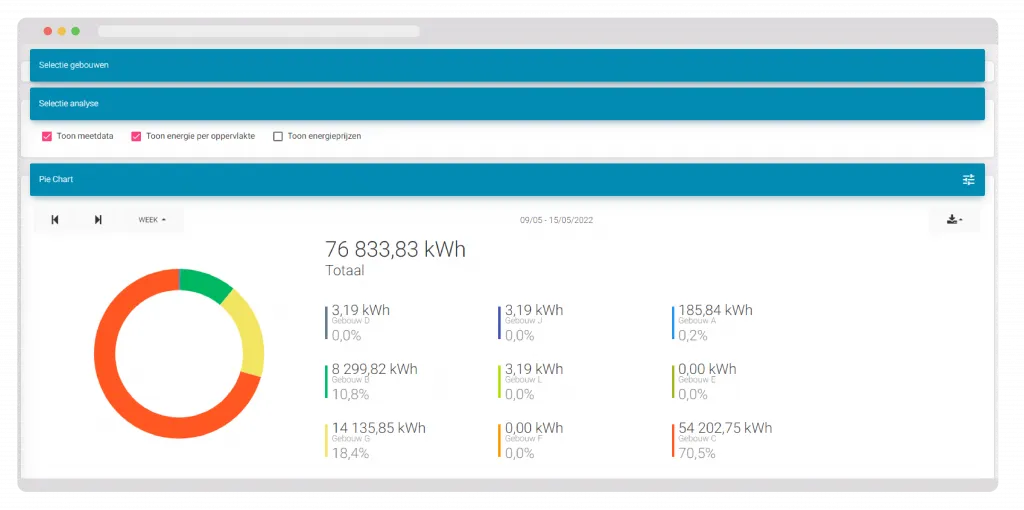
Whether it's a quick visual check or a detailed comparison, Eniris Insights provides you with the tools you need.

  • Virtual meters: calculate unmeasured points
  • kWh max analyses, base load analyses
  • Compare sensors & energy meters
  • Various visualizations (heat map, pie charts, bar charts, etc.)

Reporting

Insight into data

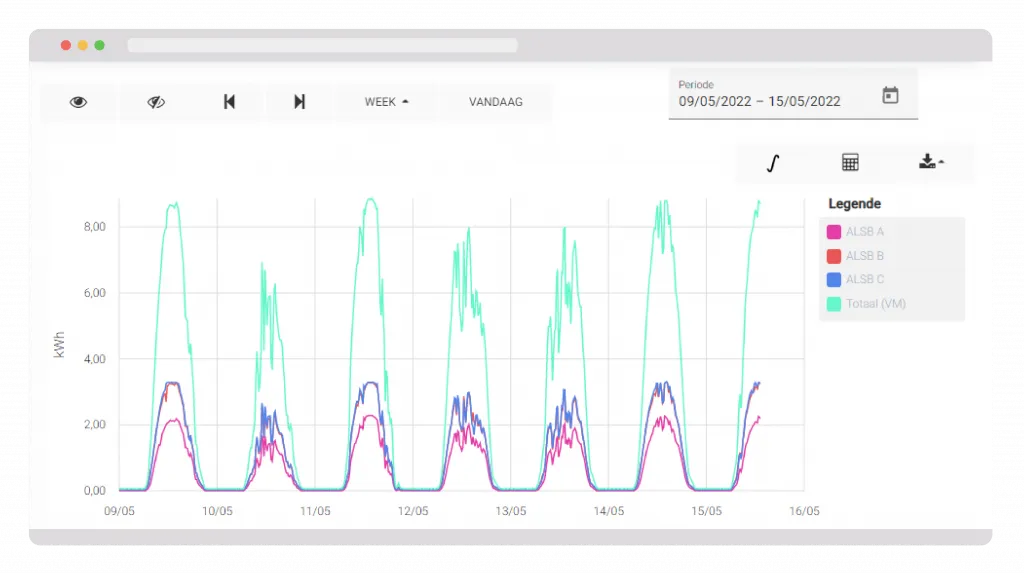
A comprehensive range of visual tools in the form of widgets help you gain in-depth insight into your energy consumption and performance. These widgets are powerful tools that enable you to optimize your energy management and achieve your business objectives.

Line graph showing daily kWh energy consumption from May 9 to May 15, 2022, for categories ALSB A, ALSB B, ALSB C, and Total (VM).
Laptop screen showing a dark-themed solar energy monitoring dashboard with heatmaps for power output and uptime data across various inverters.
+
250
Integrations
+
80
Widgets
32
%
Reduction in energy consumption

Support for administrators and technicians

Support

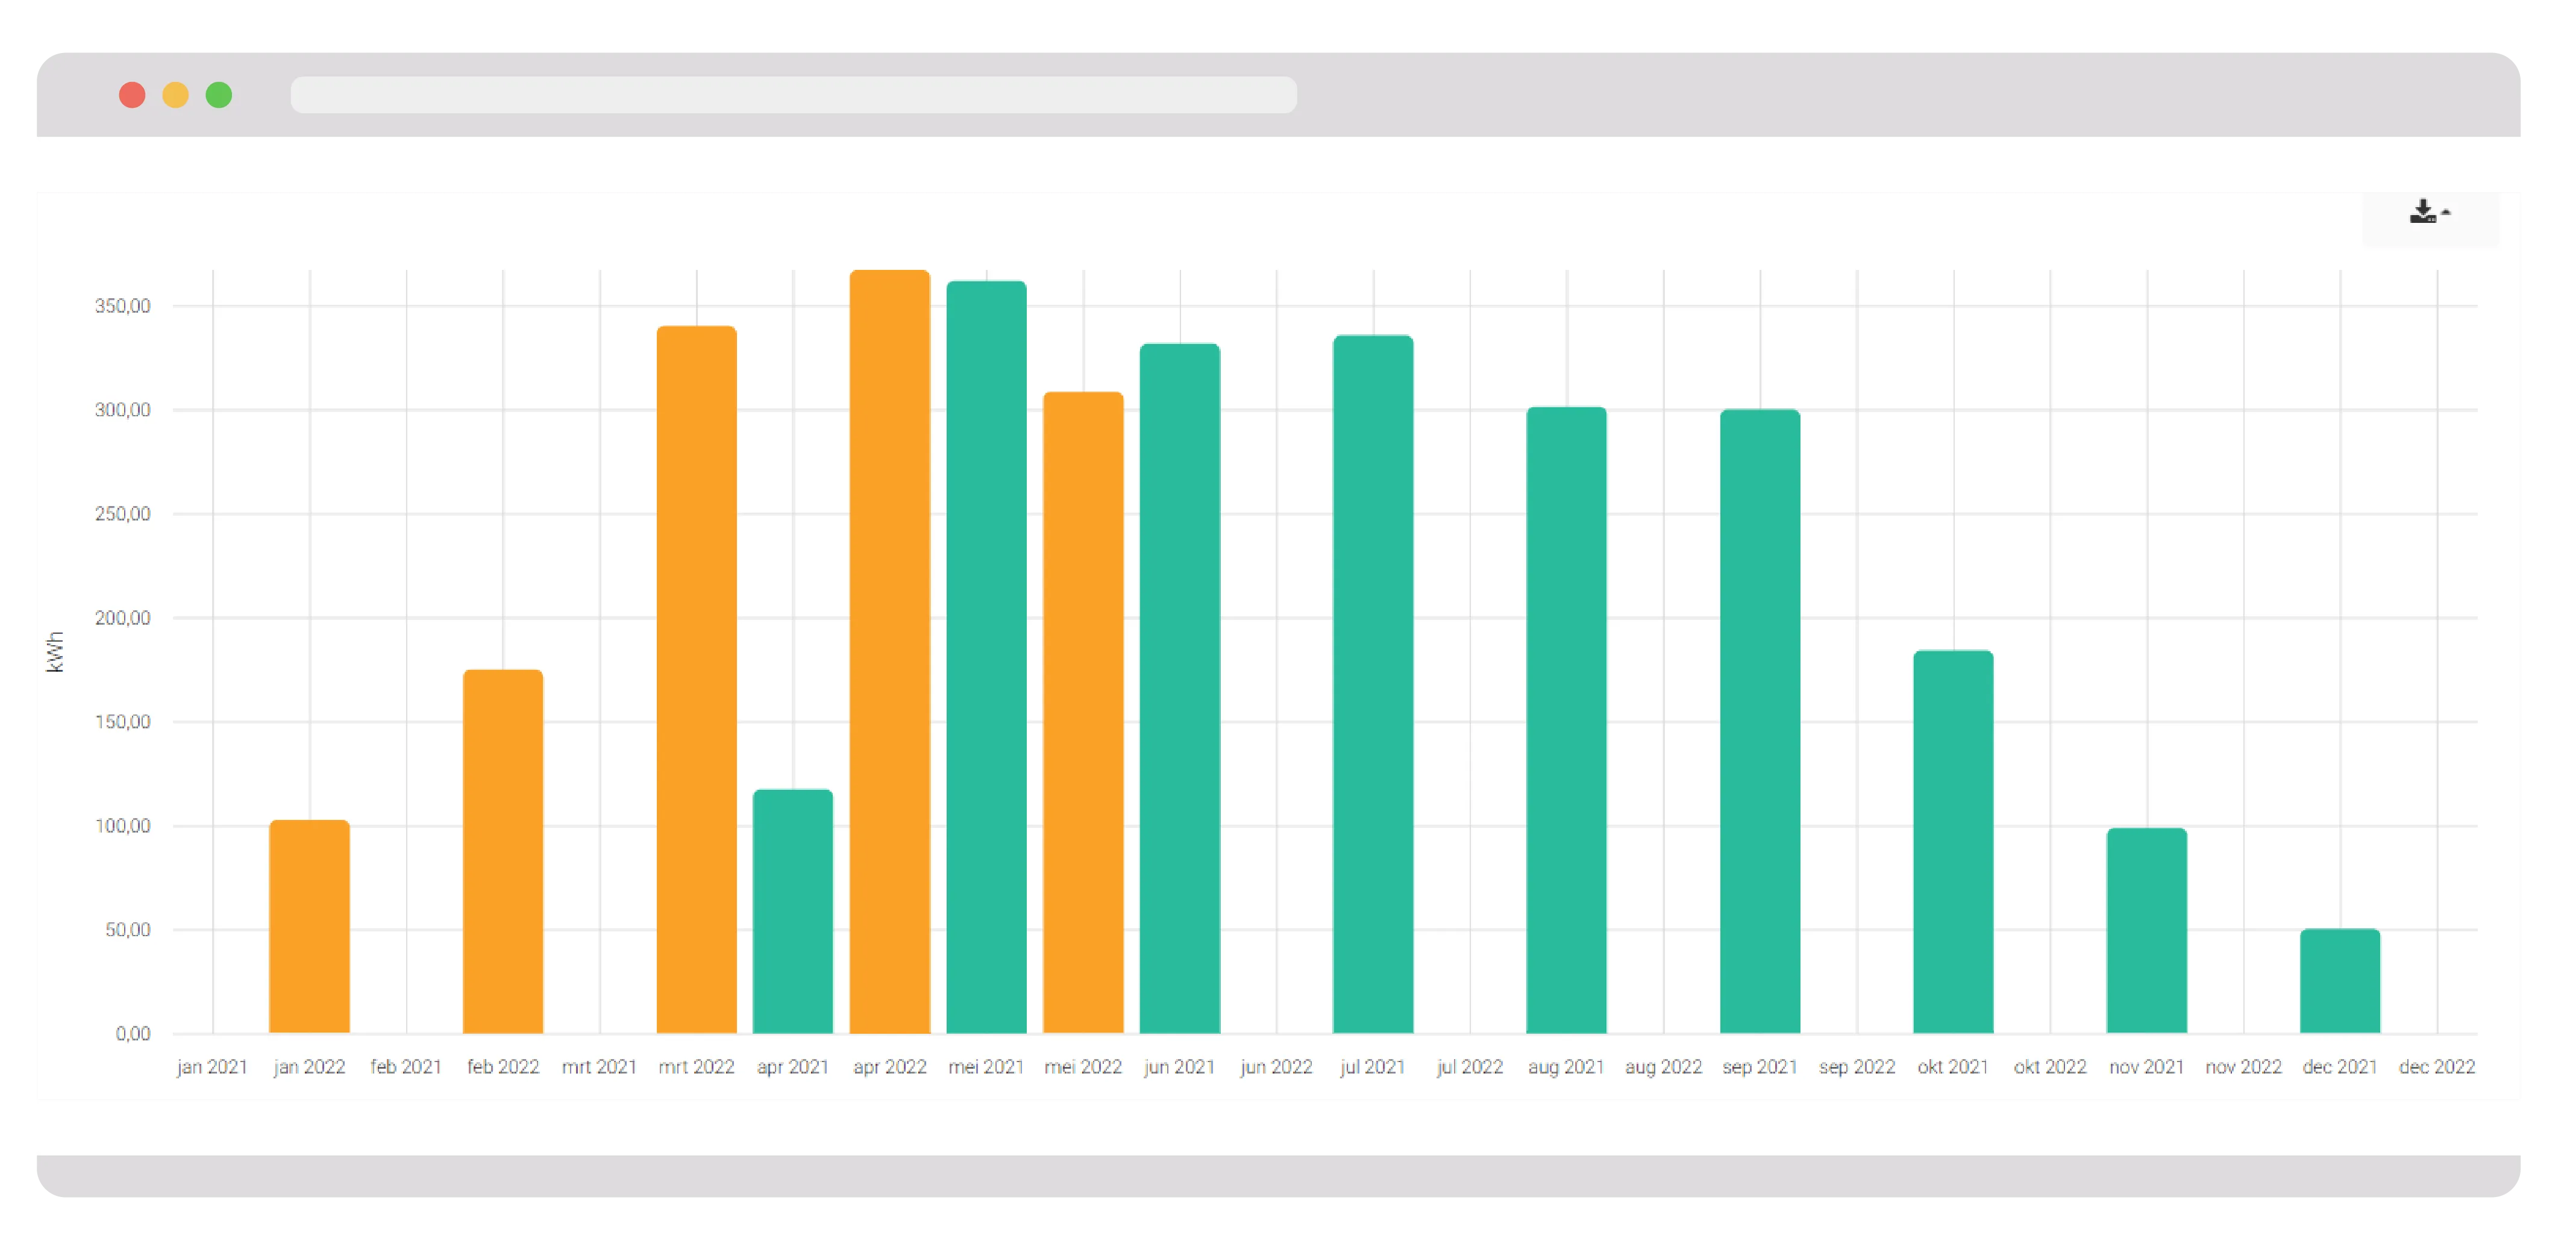
Our reporting capabilities are designed to provide you with fully automated, detailed, actionable information about your energy consumption and performance. Our powerful reporting tools allow you to collect, analyze, and present data in a way that suits your specific needs and objectives.

We provide the tools and platforms that take your installations to the next level, ensuring your customers always achieve the best results.

  • Manuals
  • Technical information
  • Helpdesk
Eniris Wiki

How it operates

Data capture

Measurement data can be sent to Eniris Insights in various ways:

  • via MQTT
  • via API
  • via FTP data (specific integration)
Diagram showing energy monitoring system integration featuring a laptop with energy data, connected to smart meters, controllers, inverters, and an electric vehicle charger.

Support

Insights 3 is a software framework developed by Eniris. It is the result of years of research, innovation, and development, and it forms the core of our commitment to improving energy management and sustainability.

  • 24/7 Online
  • Monthly updates
  • White label
More about Insights 3